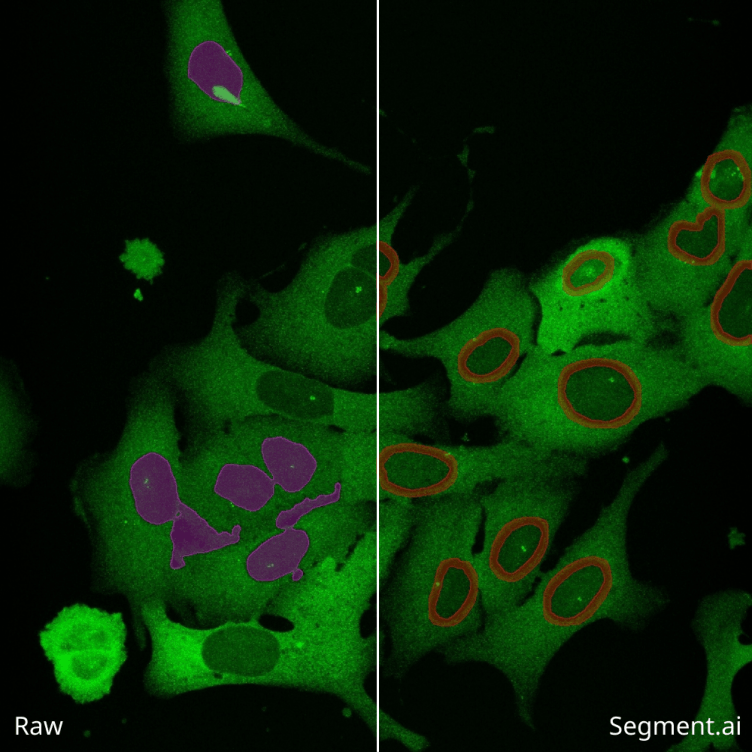
Excitation of a sample with Green Fluorescent Protein (GFP) dye
The principle of fluorescence in microscopy is based on the ability of certain molecules, called fluorophores, to absorb light at a specific wavelength and then emit light at a longer wavelength.
When a sample is fluorescently labeled, it means that specific molecules or structures of interest have been tagged with fluorescent dyes or proteins.
Fluorescence VS Brightfield
- For fixed sample imaging
- Involve dying (pre-process after sampling) or using Differential
Interference Contrast (DIC)/Phase Contrast for observation.
- Require normal white light only.
- Bleaching won't occur.
*Filter cube varies when using different fluorochrome/dye. If you need any help in choosing a filter cube, feel free to contact us.
Since fluorescence microscopy allows users to observe and acquire images of living cells, it is possible to study their chemical or physical reactions, while brightfield microscopy cannot.
- Sample which is fluorescently labeled..
- Excitation light source at certain wavelength.
- Filter cube (varies when using different fluorescent dyes or proteins).
- A microscopy setup that allows for fluorescence microscopy.
0. Labelling (Pre-process): Specific molecules or structures of interest are tagged with fluorescent dyes or proteins.
1. Excitation: The sample is illuminated with light of a specific wavelength, known as the excitation wavelength.
2. Absorption: Fluorophores present in the sample absorb the excitation light energy.
3. Emission: The fluorophores emit light at a longer wavelength, known as the emission wavelength.
4. Observation / Imaging: The emitted light is collected by the microscope's objective lens and focused onto the eyepieces/camera.
- Monochromaticity: Lasers emit highly specific wavelengths, while lamps/LEDs have a broader range with filter cubes used for selection.
- Intensity and Power: Lasers provide high-intensity light suitable for demanding applications. Lamps/LEDs have lower output but are sufficient for routine imaging.
- Spatial Coherence: Lasers exhibit high spatial coherence, maintaining focused beams. Lamps/LEDs emit light in multiple directions.
- Stability and Switching Speed: Lasers offer excellent stability and rapid switching. Lamps/LEDs can be stable but have slower switching times.
- Cost: Lasers are more expensive, while lamps/LEDs are cost-effective for routine imaging.
Photobleaching occurs when excitation light irreversibly damages the fluorophore, leading to fluorescence loss. Factors such as reactive oxygen species (ROS) generation, heat, high excitation intensity, long exposure times, and specific sample environments contribute to photobleaching. Different fluorophores have varying susceptibility to photobleaching based on their properties.
Osteocytes form an intercellular network similar to a neuronal network in bone. The research team visualizes and measures this network structure, the functional significance of which remains to be elucidated. Using Nikon NIS-Elements' Segment.ai, osteocytic lacunae are automatically segmented in order to facilitate the measurement of their numbers and morphology.
Auto-fluorescence imaging of Villanueva-stained rabbit tibia. This image was taken as a Z stack with a resolution of 0.04 um/pixel using a 100X objective, subjected to enhanced resolution processing, and displayed as a maximum intensity projection (MIP). Scale bar: 20 um
Results of segmentation by the conventional binarization method (blue). Structures other than osteocytic lacunae, such as osteocytic canaliculi and some parts of bone marrow, were detected (arrows). Manual mask modification or removal is required for accurate measurement.
Results of segmentation using Segment.ai (orange). Only the osteocytic lacunae were fully detected by Segment.ai, which learned how to identify osteocytic lacuna areas.
Some images are nearly impossible to segment by traditional intensity thresholding methods. A neural network can be trained by human classification of structures of interest that cannot easily be defined by classic thresholding and image processing by using Segment.ai.
By tracing features of interest and training these compared to the underlying image, the neural network can learn and apply segmentation to similar images, recognizing features previously only identifiable by painstaking manual tracing approaches. Learn More>>
Since a resonant scanner can perform confocal imaging with higher temporal resolution than a Galvano scanner, it is used in many cases to acquire life phenomena occurring at high speeds. In contrast, because the resonant scanner of the new generation AX R confocal microscope system supports up to 2K x 2K acquisition, it can be used for a wide range of purposes, from high-speed imaging to high-resolution imaging. Learn More>>
In this study, Dr. Matsumoto et al. established a method for quantifying observed microstructural changes using the Fourier transform. When human renal biopsy samples were evaluated using this method, the degree of disruption of glomerular epithelial cell foot processes was correlated with the amount of urinary protein
Obstacle
Although an electron microscope is usually required to visualize these microstructural changes, most renal biopsy tissue is prepared as an optical microscope specimen, and the specimens observed with an electron microscope are so small that important lesions could be overlooked. Establishing a method for evaluating these lesions over the entire collected tissue using an optical microscope specimen has therefore been anticipated.
In patients with lgA nephropathy, it was observed that the higher the amount of urinary protein, the higher the degree of structural disruption of the foot process.
In a mouse model of tubular stromal disorders due to LPS administration or ischemia-reperfusion injury, mitochondrial fragmentation and swelling in tubular epithelial cells werw observed.
The N-SIM S utilizes Structured Illumination Microscopy (SIM) technology to capture the minute structures within a specimen at twice the resolution of conventional light microscopes.
- Lateral resolution: 115 nm (3D-SIM mode),
86 nm (TIRF-SIM mode)
- Axial resolution: 269 nm (3D-SIM mode)
- Field of view: Up to 66 um x 66 um (with a
100X objective)
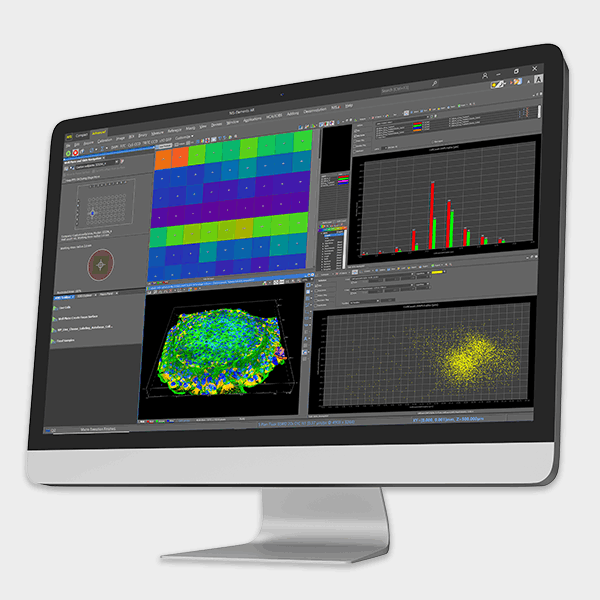
With Nikon microscope and software NIS-Elements, our high content imaging streamlines high-speed imaging and simple operations.
*Photos courtesy of Nikon official website
Create your own web page with Mobirise